
1. Introduction
2. Procedure
3. Wilcoxon Signed-Rank test with SPSS
4. SPSS commands
5. Literature
1. Introduction
The Wilcoxon Signed-Rank test is a non-parametric statistical procedure used for determining whether there are differences in the central tendency of two dependent groups (or samples). The dependent variable should be at least ordinal scaled. The Wilcoxon Signed-Rank test can be used in cases where the normal distribution prerequisite of interval scaled dependent variables is excessively violated and where carrying out a t-test is not possible.
With the Wilcoxon Signed-Rank test, the calculation of the test statistic is based on the ranking sequence of the differences in paired samples of the dependent group. The differences in paired samples are formed by allocating every value from the first group to the respective value from the second group. The two groups must have the same sample size.
2. Procedure
This chapter explains in detail the procedure of the Wilcoxon Signed-Rank test based on the following question:
Will a discount on the online purchase of a product influence its sales?
The literature summarizes the procedure of the Wilcoxon Signed-Rank test in three steps, which are described in the following section.
2.1 Model formulation
The question is examined based on a hypothetical dataset that includes fictitious daily sales figures before and after the introduction of a discounted offer by means of 30 otherwise identical online ads. The answer to the question can be found with the help of a model, which in this case looks as follows:
Figure 1: Example model
This example considers the interval scaled variables of “daily sales before discount offer” and of “daily sales after discount offer”. One of the two variables (“daily sales before discount offer”) is not normal distributed, and it its therefore necessary to carry out the Wilcoxon Signed-Rank test instead of the t-test for paired samples.
2.2 Calculating the test statistic
This section explains how to calculate the test statistic. Table 1 shows the example dataset:
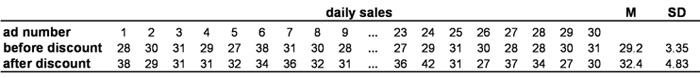
Table 1: Example data Note: M = mean; SD = standard deviation
The calculation of the test statistic is based on the differences in paired samples, which are shown in Table 2:
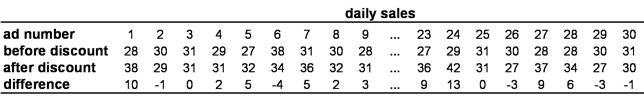
Table 2: Differences in paired samples
The calculation of the test statistic uses the differences in paired samples, which are unequal to zero. In this example, 26 differences in paired samples are are unequal to zero. The absolute values of the differences in paired samples are arranged in an ascending ranking sequence. In the case of ties (repeated occurrences of the same rankings), averaged ranking is allocated:
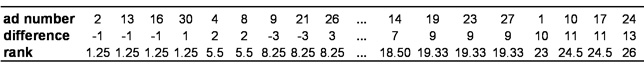
Table 3: Ranking sequence of differences in paired samples
Based on the ranking sequence, it is possible to calculate the sums of ranks for all negative and all positive differences in paired samples by adding up all the ranking positions of the respective sign. The calculation of the sums of ranks of the example dataset is as follows:
T- = 1.25 + 1.25 + 1.25 + 7.25 + 7.25 + 7.25 + 11.50 + 16.50 = 53.5
T+= 1.25 + 5.50 + 5.50 + 7.25 + 11.50 + 13.33 + 13.33 + 13.33 + 16.50 + 18.50 + 18.50 + 19.33 + 19.33 + 19.33 + 23 + 24.50 +24.50 + 26 = 280.5
The following relationship exists between the two sums of ranks:
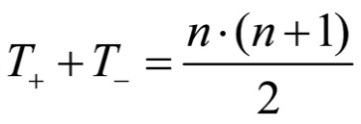
Figure 2: Relationship between T- and T +
whereby
n = the number of differences in paired samples unequal to zero
The smaller of the two values serves as the test statistic W:
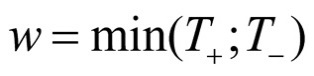
Figure 3: Test statistic W
In this example, the test statistic w is 53.5 and thus equals the value of T-.
In cases where there are no differences in the means, the test statistic equals half of the total of the sums of ranks and is calculated as follows:
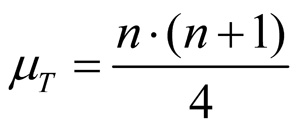
Figure 4: Test statistic w in the absence of any differences in the means
whereby
n = the number of differences in paired samples unequal to zero
In the example dataset, the test statistic would be 175.5 if there are no differences in the means.
2.3 Testing for significance
This section explains how to determine the significance of the calculated test statistic. The calculated w-value is compared with the critical value of the theoretical w-distribution. If the sample size is greater than 25 (as in this example), it can be assumed that a normal distribution is given. In this case the test statistic is standardized and then compared with the critical value of the z-distribution. SPSS performs the comparison automatically.
The working hypothesis of the Wilcoxon Signed-Rank test states that the median value of the differences in paired samples of both groups is zero. In this example, SPSS produces a p-value of .004 (see Chapter 3: “Wilcoxon Signed-Rank test with SPSS”). Because this value is smaller than the significance level of .050, it can be assumed that the median value of the differences in paired samples of the two groups is unequal to zero.
3. Wilcoxon Signed-Rank test with SPSS
3.1 For older SPSS versions (up to SPSS 18) or the “Legacy Dialogs” in the newer versions
When performing the Wilcoxon Signed-Rank test, SPSS produces the following figures:
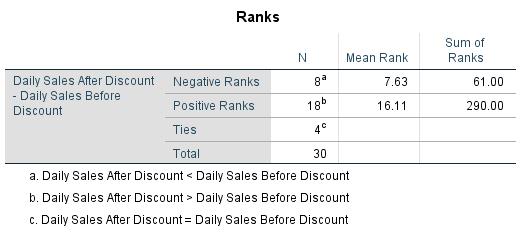
Figure 5: Sums of ranks
Figure 5 shows the sums of ranks of the two groups. “Ties” refers to the number of differences in paired samples that are equal to zero.
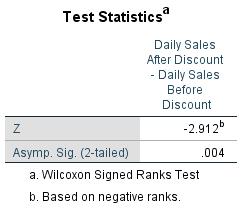
Figure 6: Test statistic
Figure 6 shows the test statistic and the p-value, which is smaller than the significance level of .050. It can be assumed that by introducing the discount offer by means of 30 otherwise identical online ads will significantly boost the daily sales figures for the product.
3.2 For newer SPSS versions (from SPSS 19)
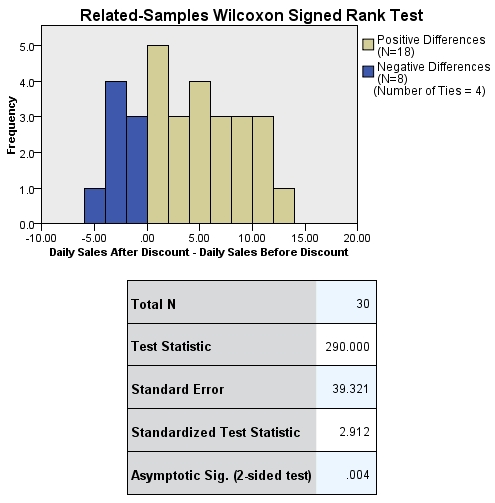
Figure 7: Model viewer
Figure 7 shows the “Model viewer” of the Wilcoxon Signed-Rank test, which in the newer SPSS versions can be opened with a double-click on “Summary of hypothesis testing.”
4. SPSS commands
SPSS dataset: Example dataset used for the Wilcoxon-Vorzeichen-Rang-Test.sav
Click sequence: Analyze > Non-parametric tests > Two paired samples
In the “Test pairs” field > Define dependent groups (“Samples”)
Syntax: NPAR TESTS WILCOXON