
1. Introduction
2. Procedure
3. Rank correlation with SPSS
4. SPSS commands
5. Literature
1. Introduction
The rank correlation is a non-parametric statistical procedure used for determining the bivariate correlation of two at least ordinal scaled attributes, whereby two ranking sequences are compared with each other. In order to determine the size of the correlation it is necessary to calculate Spearman’s or Kendall-Tau’s rank correlation coefficient. The rank correlation can be used when the prerequisite of normal distribution is excessively violated in the case of interval scaled dependent variables. The characteristics of both variables are carried over to the ranking positions.
2. Procedure
This chapter explains in detail the procedure of the rank correlation based on the following question:
Is there a correlation between public expenditures on education in 1990 and adult literacy rates in different countries in 2003?
The literature summarizes the procedure of the rank correlation in three steps, which are described in the following section.
2.1 Model formulation
The question is examined based on a dataset from Caramani (2008) that captures the situation in 114 countries. The answer to the question can be found with the help of a model, which in this case looks as follows:
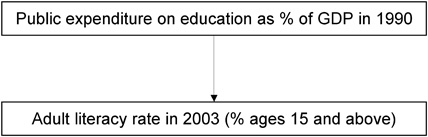
Figure 1: Example model Note: GDP = gross domestic product
The two variables of “Public expenditure on education” and “Adult literacy rate” are interval scaled. One of the two variables (Adult literacy rate) is not normal distributed. It therefore makes sense to carry out Spearman’s or Kendall-Tau’s rank correlation instead of Pearson’s rank correlation.
2.2 Calculating the correlation coefficient
This section explains how to calculate the correlation coefficient. Table 1 shows the example data as raw data that has been ranked:
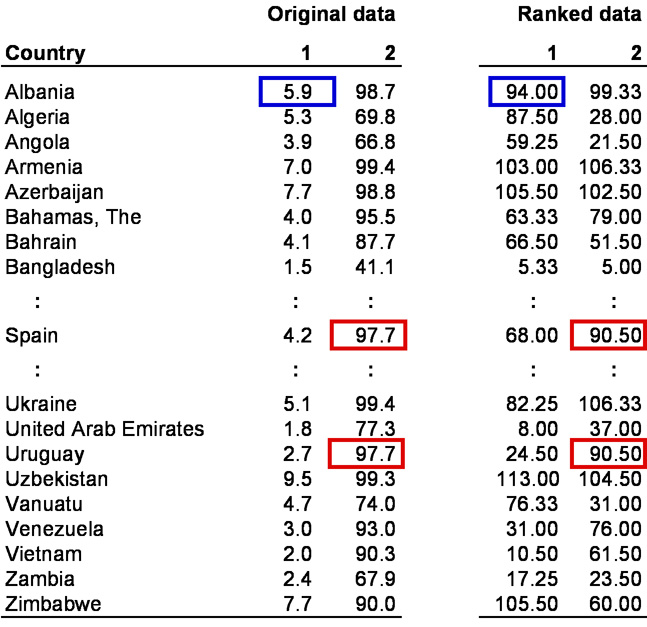
Table 1: Example data Note: 1 = “Public expenditure on education as % of GDP in 1990” variable; 2 = “Adult literacy rate in 2003 (% ages 15 and above)” variable
To calculate the rank correlation, the raw values (in this case percentages) of the two variables were converted into ranking positions, making it possible to compare the interval scaled variable and the ordinal scaled variable with each other. In this example, the ranking sequences of both variables include 114 positions (number of countries being examined). For example, Albania spent 5.9% of its gross domestic product on education in 1990, putting it in the 94th position (see blue markings in Table 1). In the case of ties (several objects produce the same value), the means of the respective rankings are formed and then allocated to the objects. For example, the population of Spain and Uruguay that was above age 15 had literacy rates of 97.7% in 2003. This corresponds to rankings of 90 and 91. In this case the value of 90.50 (means of the two positions) was used assigned to both countries (see red markings in Table 1).
Spearman’s rank correlation coefficient ρ (Rho) is calculated based on the the following equation:
Figure 2: Calculating Spearman’s rank correlation coefficient ρ (Rho)
whereby
ri = the ranking position of unit of analysis i within the first variable
si = the ranking position of unit of analysis j within the second variable
n = sample size
The mentioned equation can be used only if there are no tied ranking positions, and it can therefore not be used in this example. The literature suggests an extremely complicated equation for calculating the test statistic in cases where ties exist, and it is not possible to go into it in further depth at this point.
Kendall’s Tau-b coefficient, which is less sensitive to distortions caused by outliers, serves as an alternative to Spearman’s Rho correlation coefficient. If there are ties and the samples are small, Kendall’s Tau-b coefficient is preferable to Spearman’s Rho correlation coefficient. Kendall’s Tau-b coefficient is usually smaller than Spearman’s Rho correlation coefficient
As in the case of Pearson’s product-moment correlation coefficient, Spearman’s Rho correlation coefficient and Kendall’s Tau-b coefficient always assume values between -1 and 1, whereby negative and positive values indicate negative and positive correlations respectively.
For the example data, SPSS produces a Spearman’s Rho correlation coefficient of .305 and a Kendall’s Tau-b coefficient of .207 (see Chapter 3: “Rank correlation with SPSS”).
2.3 Testing for significance
This section examines the correlation coefficient for significance. The null hypothesis of the rank correlation states that the correlation coefficient equals zero. The size of the correlation coefficient makes it impossible to determine whether there is a significant correlation. Sample size is one of the factors that influences whether a particular correlation coefficient is significant. In the case of large samples, for example, it is possible for a small correlation coefficient to be significant. The significance of the rank correlation coefficient is verified by means of a t-test.
SPSS produces the p-value automatically when calculating the correlation. The SPSS “Bivariate correlations” dialogue window distinguishes between a one-tailed test for significance and a two-tailed test for significance. If there are no assumptions about the direction of the two variables’ correlation (in the case of non-directional hypotheses), it makes sense to conduct a two-tailed test.
In this example, SPSS produces a p-value of .013 both for Spearman’s Rho correlation coefficient and for Kendall’s Tau-b coefficient (see Chapter 3: “Rank correlation with SPSS”). Because this value is smaller than the significance level of .050, it can be assumed that both correlation coefficients differ significantly from zero.
3. Rank correlation with SPSS
SPSS produces the following figures when calculating the rank correlation:
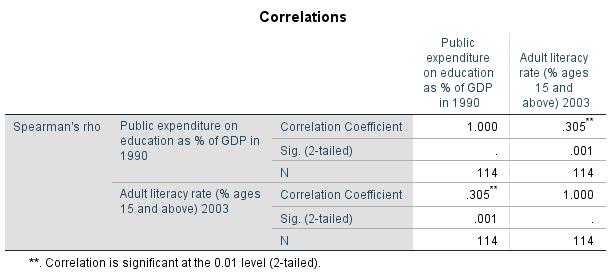
Figure 3: Spearman’s Rho correlation coefficient with the associated p-value
Figure 3 shows Spearman’s Rho correlation coefficient with the associated p-value.

Figure 4: Kendall’s Tau-b correlation coefficient with the associated p-value
Figure 4 shows Kendall’s Tau-b correlation coefficient with the associated p-value. Because this value is smaller than the significance level of .050, the null hypothesis is rejected and the alternative hypothesis accepted. The two variables being tested have a significant, positive correlation. The greater the public expenditures on education in the various countries in 1990, the higher the adult literacy rates were in 2003.
4. SPSS commands
SPSS dataset: Example dataset used for the Rangkorrelation.sav
Click sequence: Analyze > Correlation > Bivariate
In the dialogue box, select “Spearman” and/or “Kendall’s Tau-b.”
Syntax: NONPAR CORR