
1. Introduction
2. Procedure
3. Chi-square test for variance with SPSS
4. SPSS commands
5. Literature
1. Introduction
The chi-square test for variance is a non-parametric statistical procedure with a chi-square-distributed test statistic that is used for determining whether the variance of a variable obtained from a particular sample has the same size as the known population variance of the same variables. In order to determine the population variance, it is necessary to examine the entire population. It is often sufficient to obtain the population variance based on a representative sample. When conducting the chi-square test, the variable being tested can have any level on a scale.
2. Procedure
This chapter explains in detail the procedure of the chi-square test for variance based on the following question:
Does the variance of the waiting times of an airline’s passengers differ depending on whether they wait at the check-in counter in separate queues or in a single large queue?
The procedure of the chi-square test for variance is summarized in three steps, which are described in the following section.
2.1 Schematic representation
The customers of a hypothetical airline usually wait in a single large queue to drop off their luggage. The average variance of the waiting time in a single large queue is known and in this example comprises the population variance. A pilot study of 27 passengers used separate queues for each counter. Here, the average variance of the waiting times was measured for the separate queues, making up the sample variance in this case. The answer to the questions can be found with the help of a schematic representation, which in this case looks as follows:
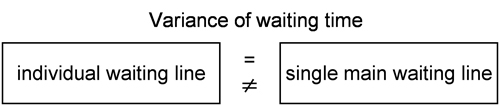
Figure 1: Schematic representation
In this example, the dependent variable of “waiting time” (in minutes) is included.
2.2 Calculating the test statistic
In this example, the average standard deviation of the waiting time for a single queue is 4.7 minutes. Accordingly, the population variance is 22.09 (square of the standard deviation). The average standard deviation of the waiting time for separate queues of the pilot project with 27 passengers is 8.1 minutes. Accordingly, the sample variance is 65.61 (square of the standard deviation).
The test statistic of the chi-square test for variance is calculated as follows:
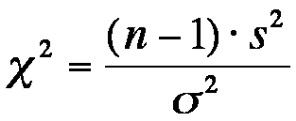
Figure 2: Calculating the chi-square test statistic for variance
whereby
n = the sample size
s2 = the sample variance
σ² = the population variance
For the example data, calculating the test statistic produces the following result:
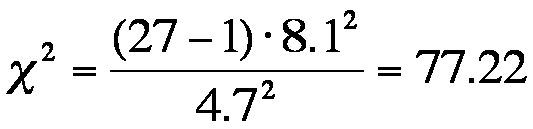
Figure 3: Calculating the test statistic of the example data
The chi-square test statistic of the example is 77.22.
2.3 Testing for significance
This section explains how to determine the significance of the calculated test statistic. The calculated value is compared with the critical value of the chi-square distribution as determined by the degree of freedom.
The hypothesis in this example is non-directional. The test determines if differences exist; it does not determine the direction of the assumed differences (e.g. which variance is smaller or bigger).
The critical values are shown in the chi-square tables.
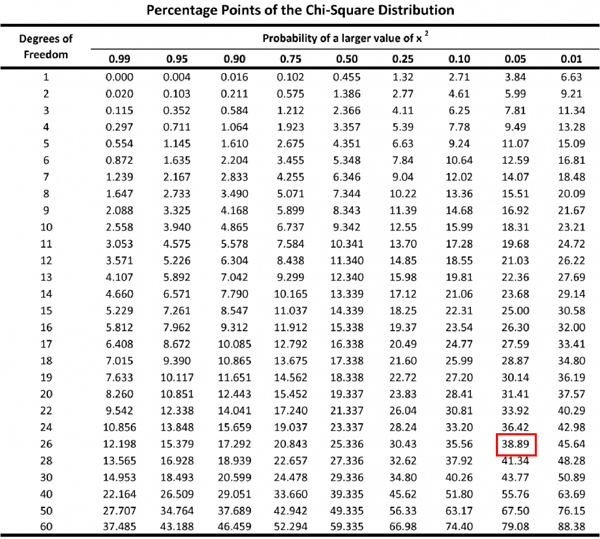
Table 1: Excerpt from a chi-square table
The F-table shows the critical value of various significance levels. In this example, the degree of freedom is n – 1 = 27 – 1 = 26. A significance level of .05 is selected, whereby the relevant critical value is 38.89 (see red marking in Table 1). The calculated test statistic is greater than the critical value (77.22 > 38.89). It can therefore be assumed that the variances of the waiting time differ depending on whether an airline’s passengers wait in separate queues for each counter or in a single large queue when checking in.
3. Chi-square test for variance with SPSS
It is not possible to perform the chi-square test for variance in SPSS. The sample variance can be calculated with SPSS.
4. SPSS commands
Click sequence: Analyze > Descriptive statistics > Frequencies
Variance: In the “Statistics” window, select “Variance.”
Syntax:
FREQUENCIES VARIABLES
/STATISTICS=VARIANCE