
1. Introduction
2. Procedure
3. Binomial test with SPSS
4. SPSS commands
5. Literature
1. Introduction
The binomial test is a non-parametric statistical procedure for determining whether the frequency distribution of nominal scaled, dichotomous variables corresponds with an assumed distribution. Here, the probability of the respective variable assuming one of the two characteristics is compared with the actual frequency.
2. Procedure
This chapter explains in detail the procedure of the binomial test based on the following question:
Are the correct answers of a student taking a multiple-choice test the result of “pure” guessing?
The binomial test is summarized in three steps, which are described in the following section.
2.1 Model formulation
The answer to the question can be found with the help of a model. The question is examined by means of a dataset that captures the student’s behavior while answering a multiple-choice test with 80 items in which the correct answer is one out of 4 options. In this case, the model looks as follows:
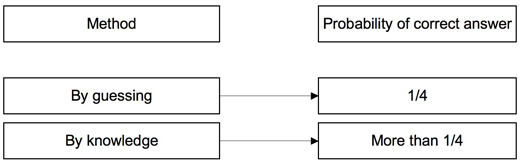
Figure 1: Example model
If the student only guesses, the probability of getting the right answer is .250 (1/4). If the student has some knowledge of the subject, the probability of getting the right answer is greater than .250 (1/4).
2.2 Calculating the test statistic
This section explains how to calculate the test statistic. Table 1 shows the example dataset:

Table 1: Example data
In this example, the student answered 32 of the items correctly. The observed frequency of the right answer is 32/80 or 40% (see Chapter 3: “Binomial test with SPSS”). This frequency is greater than the expected frequency of 25% that applies if the student has no knowledge of the subject.
2.3 Testing for significance
This section examines if the observed value differs significantly from the expected value. The calculated frequency value is therefore compared with the previously defined critical value of the binomial distribution.
In this example, the critical value is .250. SPSS produces a p-value of .002 (see Chapter 3: “Binomial test with SPSS”). This value is less than .050, which indicates that the result is significant. The observed frequency of the correct answers differs significantly from the expected frequency. The student’s correct answers while taking the multiple-choice test are most likely the result of her knowledge of the subject and not of pure guessing.
3. Binomial test with SPSS
SPSS produces the following figures when performing the binomial test:
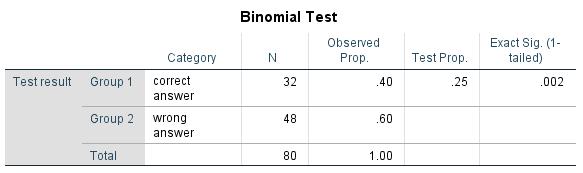
Figure 2: Calculating the binomial test
Figure 2 shows the percent of the frequencies in the “Observed prop.” and the expected frequency (previously determined with the “Binomial test” dialogue box of SPSS) in the “Test prop.” Because the output p-value is less than .050, it can be assumed that the number of correct answers differs significantly from the number that can be expected as the result of pure guessing.
4. SPSS commands
SPSS dataset: Example dataset used for the Binomialtest.sav
Click sequence: Analyze > Nonparametric tests > Binomial
Syntax: NPAR TESTS BINOMIAL