
1. Introduction
2. Procedure
3. Mann-Whitney U test with SPSS
4. SPSS commands
5. Literature
1. Introduction
The Mann-Whitney U test is a non-parametric statistical procedure used for determining if there are differences in the central tendency of more than two independent groups (or samples). The dependent variable should be at least ordinal scaled. A normal distribution is not a prerequisite. The Mann-Whitney U test can be used when the prerequisite of normal distribution of interval scaled dependent variables is excessively violated.
The Mann-Whitney U test is a sum of ranks test or a rank test in which the test statistic is calculated based on a comparison of two rank sequences. The two groups do not need to be of the same sample size. The values of the two groups are then used for forming a common sequence in ascending order. This is based on the idea that the data of two independent groups in a sequence of joint ranks will have the same distribution if it has the same central tendency.
2. Procedure
This chapter explains in detail the procedure of the Mann-Whitney U test based on the following question:
Are there differences in the central tendency of loan amounts between borrowers who have repaid their loan and those who have not?
The literature summarizes the procedure of the Mann-Whitney U test in three steps, which are described in the following section.
2.1 Model formulation
The question is examined based on a dataset from the archive of the Department of Statistics at Ludwig Maximilian University Munich and the Collaborative Research Centre. The data concerns the classification of borrowers and was collected by a major German bank a few years ago. The answer to the question can be found with the help of a model, which in this case looks as follows:
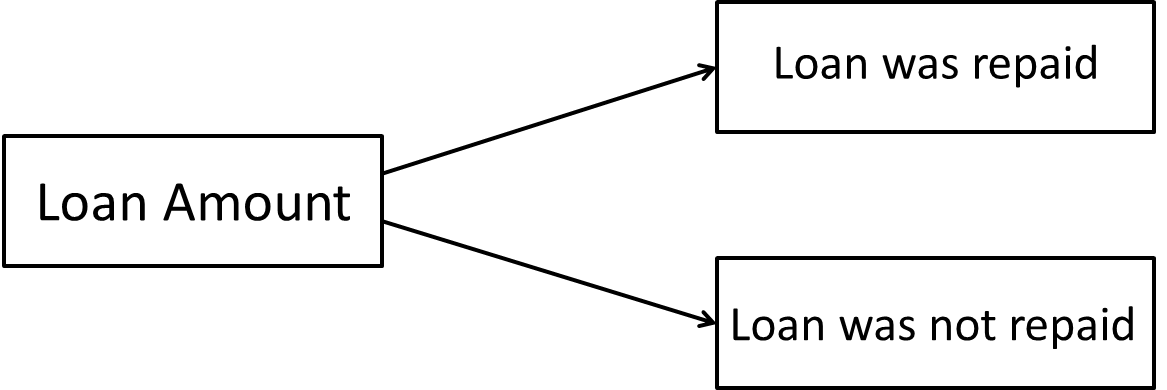
Figure 1: Example model
In this example, two variables were considered: The dummy variable „Loan“ (with the levels „Loan was repaid“ and „Loan was not repaid“) as well as „Loan amount in Deutsche Mark.“ This variable is ordinal scaled rather than interval scaled because it has been discretized to ten levels.
2.2 Calculating the test statistic
This section explains how to calculate the test statistic. Table 1 shows, among other things, the mean ranks and the rank-sums of the two independent groups of the example dataset:
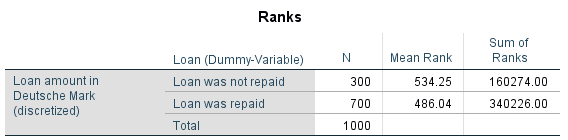
Table 1: Example data Note: N = group size
The Mann-Whitney U test determines if the difference of the mean ranks is significant. The calculation of the test statistic is based on the sequence of joint ranks of both groups, as shown in Table 2:
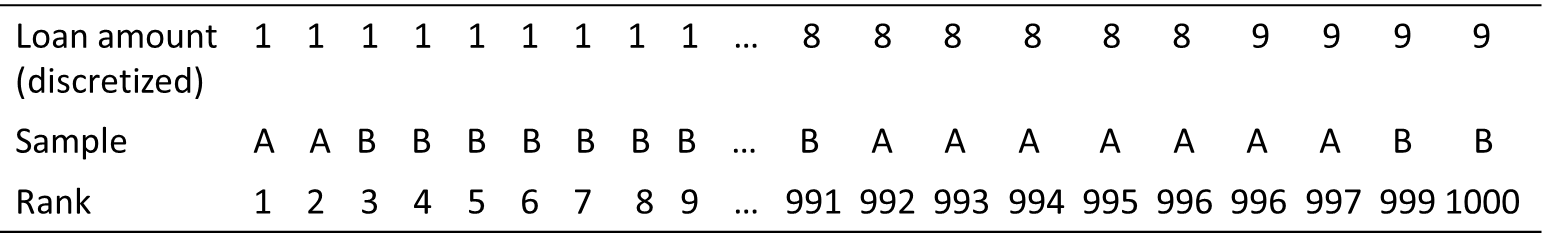
Table 2: Sequence of joint ranks. Note: A = „Loan was not repaid“, B =“Loan was repaid“
If the central tendency of both groups is the same, their ranking would be evenly aligned. In the case of groups with only 4 units, the pattern would look as follows:
ABABABABAB or AABBBBAA
In the case of two groups with only 4 units and different central tendencies, the pattern would look as follows in an extreme case:
AAAABBBB
In the mentioned pattern, group 1 would, for example, occupy the lower ranks and group 2 the higher ranks in a joint rank sequence. There would be a large difference in the central tendencies.
The test statistic U of the Mann-Whitney U test examines the null hypothesis to see if the ranking is evenly aligned in the sequence of joint ranks. For the first group, the test statistic is calculated as follows (in the example of „Loan was not repaid“):
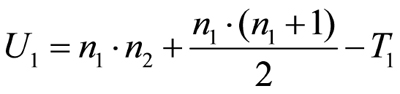
Figure 2: Calculating the test statistic for group 1
whereby
n1= the size of group 1
n2= the size of group 2
T1= the sum of ranks of group 1
The test statistic for the second group („Loan was not repaid“) is calculated in the same way:

Figure 3: Calculating the test statistic for group 2
whereby
n1= the size of group 1
n2= the size of group 2
T2= the sum of ranks of group 2
The sums of ranks of the groups is calculated by adding up all the ranking positions in the respective rank sequence. In this example, the sum of ranks of group 1 („Loan was repaid“) is 340,226 and U1 is therefore 360,474. The sum of ranks for sample 2 („Loan was not repaid“) is 160,274, and U2 is 94,876. The test value is the smaller of the two values, or 94,876 in this case.
U reflects the amount by which the ranking position was exceeded. The U value can be calculated manually by counting the number of times in which every ranking of one group is exceeded by a ranking from the other group. Counting in large groups is very cumbersome, which is why U is calculated based on the sums of ranks.
2.3 Testing for significance
This section explains how to determine the significance of the calculated test statistic. The smaller U-value is compared with the critical value of the theoretical U-distribution. If both groups have more than 10 units each, the U-distribution is virtually the same as a normal distribution, and the test statistic is then compared with the critical value of the z-distribution.
In the case of smaller groups (n1 < 10 and/or n2 < 10), the row in SPSS with the „Exact significance“ is relevant. In the case of larger groups, the p-value of the „Asymptotic significance“ row is used (see Chapter 3: „Mann-Whitney U test with SPSS“). In this example, SPSS produces a p-value of .013. Because this value is smaller than the significance level of .050, it can be assumed that the central tendency of the two groups differs.
3. Mann-Whitney U test with SPSS
SPSS produces the following figures when performing the Mann-Whitney U test:
Figure 4: Sums of ranks
Figure 4 shows the mean ranks and the sums of ranks of the two groups. The mean rank of the discretized loan amount for borrowers who failed to repay their loan is larger than for those who repaid the loan.
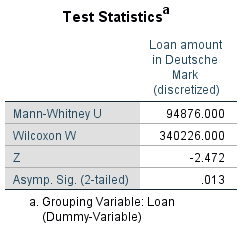
Figure 5: Test statistic
Figure 5 shows the test statistic U and the p-value, which is smaller than the significance level of .050. It can therefore be assumed that the central tendency of loan amounts between borrowers who have repaid their loan and those who have not differs significantly.
4. SPSS commands
SPSS dataset: Example dataset used for the Mann-Whitney-U-Test.sav
Click sequence: Analyze > Non-parametric tests > Two independent random samples
In the „Test variables“ field > Dependent variable(s)
In the „Group variable“ field > Define two independent groups („Samples“)
Syntax: NPAR TESTS M-W