
1. Introduction
2. Procedure
3. Kruskal-Wallis test with SPSS
4. SPSS commands
5. Literature
1. Introduction
The Kruskal-Wallis test is a non-parametric statistical procedure used for determining whether there are differences in the central tendency of more than two independent groups (or samples). The dependent variable should be at least ordinal scaled. A normal distribution is not a prerequisite. The Kruskal-Wallis test can be used when the prerequisite of normal distribution is excessively violated in the case of interval scaled dependent variables.
The Kruskal-Wallis test is a sums of ranks test or rank test in which the test statistic is calculated based on a comparison of more than two rank sequences. The groups do not need to be of the same sample size. The values of the groups are then used for forming a common sequence in ascending order. The underlying idea is that the data of independent groups in a sequence of joint ranks will have the same distribution if it has the same central tendency. The Kruskal-Wallis test is an extension of the Mann-Whitney U test for two independent groups.
2. Procedure
This chapter explains in detail the procedure of the Kruskal-Wallis test based on the following question:
Are there differences in the central tendency of the results of a written exam between students in different programs (general / vocational / academic)?
The literature summarizes the procedure of the Kruskal-Wallis test in four steps, which are described in the following section.
2.1 Model formulation
The question is examined based on a dataset from Academic Technology Services (Statistical Consulting Group) at the University of California, Los Angeles (UCLA). When entering high school, students must, among other things, take a written exam, the results of which are included in the dataset. In addition, they must decide on a particular major by choosing either the general, the vocational, or the academic program.
The answer to the question can be found with the help of a model, which in this case looks as follows:
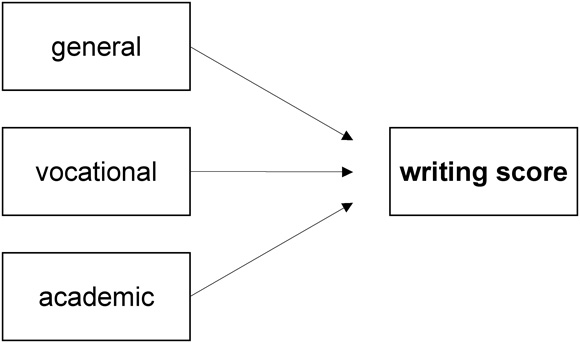
Figure 1: Example model
In this example, the interval scaled, dependent “writing score” variable of the written exam is not normal distributed, and it is therefore necessary to conduct the Kruskal-Wallis test instead of the analysis of variance.
2.2 Calculating the test statistic
The calculation of the test statistic of the Kruskal-Wallis test is based on the sequence of joint ranks of the groups, which is shown in Table 1:

Table 1: Extract from the sequence of joint ranks Note: A = general, B = vocational, C = academic
In SPSS, the medians can be shown as a diagram. For this, the required diagram can be selected from the “Create diagram” dialogue box (in this case “Line”).
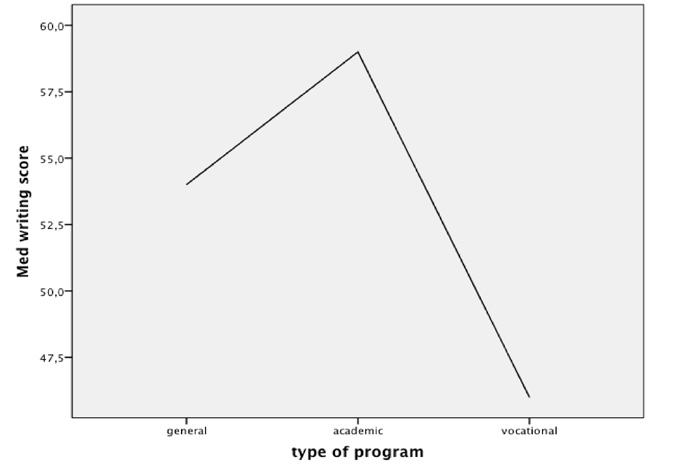
Figure 2: Graph of the central tendencies
The Kruskal-Wallis test determines if the differences in the mean ranks as shown in Figure 2 are significant.
If the central tendencies of the groups are the same, their ranking positions would be evenly aligned. In the case of three groups with only four units in each, the pattern would, for example, look as follows:
ABCABCABCABC or AABBCCCCBBAA
In the case of three groups with only four units in each and with different central tendencies, the pattern would look as follows in an extreme case:
AAAABBBBCCCC
In the mentioned pattern, group A would, for example, occupy the lower ranks, group B the medium ranks, and group C the higher ranks of the joint rank sequence. There would be a large difference in the central tendencies.
The test statistic H of the Kruskal-Wallis test examines the evenness of the distribution of the ranking positions of different groups in the sequence of joint ranks, and if no ties exist it is calculated as follows:
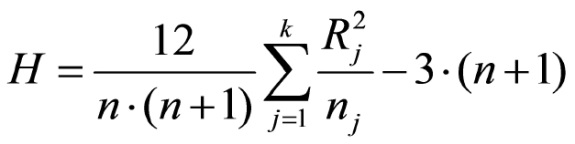
Figure 3: Calculating the test statistic H (without ties)
whereby
n = the total sample size
j = group j
k = the number of groups
nj = the sample size of group j
Rj = the sum of ranks of group j
If there are values with the same characteristics in the different samples, i.e. if ties exist, the test statistic Hb is calculated as follows:
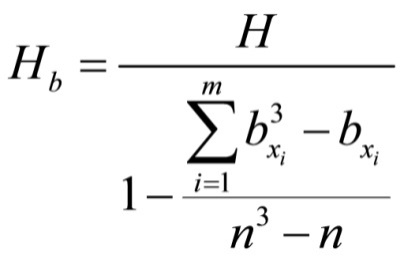
Figure 4: Calculating the test statistic Hb (with ties)
whereby
m = the number of all ties
bx = the number of ties for a single value xi
The sums of ranks of the groups is calculated by adding up all the ranking positions in the respective rank sequence. The test statistic H examines the null hypothesis as to whether the ranking is evenly aligned in the sequence of joint ranks.
2.3 Testing for significance
This section examines the test statistic for significance. In SPSS, the calculated test statistic H is compared with the critical value of the test distribution as determined by the sample size (see Chapter 3: “Kruskal-Wallis test with SPSS”).
In this example, SPSS produces a p-value of .000. Because this value is smaller than the significance level of .050, it can be assumed that there are significant differences in the central tendencies of the groups.
2.4 Post hoc test
The Kruskal-Wallis test provides no information about which central tendencies differ significantly from the others. It therefore makes sense to conduct post hoc tests (in this case “manually” through the Mann-Whitney U tests) that examine paired comparisons of the groups to determine which differences in the central tendencies have caused the Kruskal-Wallis test to produce a significant result. The new SPSS version can perform post hoc tests automatically: A double-click on “Summary of hypothesis testing” will open the “Model viewer,” in which “Paired comparisons” can be selected from “Display” (see Chapter 3: “Kruskal-Wallis test with SPSS”).
3. Kruskal-Wallis test with SPSS
3.1 For older SPSS versions (up to SPSS 18) or the “Legacy Dialogs” in the newer versions
SPSS produces the following figures when performing the Kruskal-Wallis test:
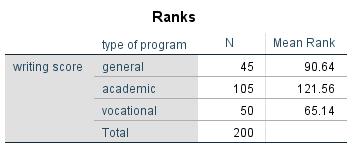
Figure 5: Mean ranks Note: N = sample size
Figure 5 shows the mean ranks of the written exam results of the three independent groups of the example data. The mean rank of the written exam results is the largest for students in the “academic” program. In the case of students in the “vocational” program, the mean rank of the written exam results is the smallest.
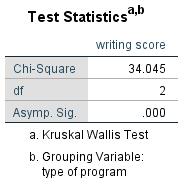
Figure 6: Test statistic H
Figure 6 shows test statistic H and the p-value. Because this value is smaller than the significance level of .050, it can be assumed that there are significant differences in the central tendencies of written exam results among students in the different programs (general / vocational / academic).
3.2 For newer SPSS versions (from SPSS 19)
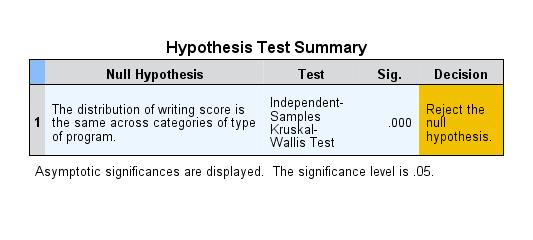
Figure 7 shows the summary of the hypothesis test. The null hypothesis according to which the central tendencies of the groups are the same is rejected in favor of the alternative hypothesis.
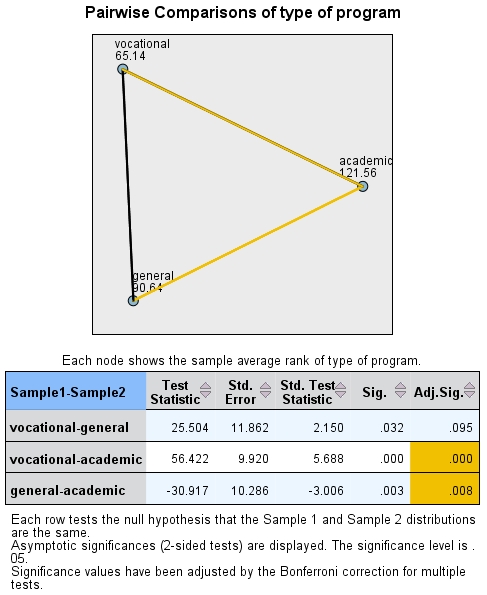
Figure 8: Post hoc tests
Figure 8 shows the paired comparisons of the two groups. The post hoc tests indicate that the central tendency of the written exam results of students in the “academic” program differ significantly from those of students in the “vocational” program and/or the “general” program. On the other hand, there are no significant differences in the central tendency of written exam results between students in the “vocational” and the “general” programs.
Students in the “academic” program had the best written exam results, students in the “general” program had the second-best results, and students in the “vocational” program had the weakest results.
4. SPSS commands
SPSS dataset: Example dataset used for the Kruskal-Wallis-Test.sav
Click sequence:
Analyze > Nonparametric Tests > Independent samples…
In the “Test variables” field > Define dependent variable(s)
In the “Group variable” field > Define two independent groups (“Samples”)
Syntax:
NPTESTS
/INDEPENDENT TEST („AV“) GROUP („UV“)) KRUSKAL_WALLIS(COMPARE=PAIRWISE)
/MISSING SCOPE=ANALYSIS USERMISSING=EXCLUDE
/CRITERIA ALPHA=0.05 CILEVEL=95.
5. Literature
Field, A. (2009). Discovering Statistics Using SPSS. London: Sage.
Gravetter, F. J. & Wallnau, L. B. (2009). Statistics for the behavioral sciences. Belmont: Wadsworth Cengage Learning.