1. Introduction
2. Procedure
3. t-Test with SPSS
4. SPSS-Commands
5. Literature
1. Introduction
A t-test for two paired samples is used when comparing the means of two measurements or observation pairs with each other and testing the differences for significance. This t-test is thus suitable for examining a difference hypothesis between two paired samples. The variable to be tested should therefore be interval scaled (LINK to scale level) and normal distributed. Furthermore, when conducting the t-test for paired samples, the two samples must be the same size.
Note: In the case of two paired samples, the objects are either allocated to each other as pairs or the observed object is examined repeatedly. When conducting a t-test for paired samples, every object of one sample can therefore be allocated to an object of the other sample. It is therefore also possible to use the terms dependent samples, paired samples, and paired two-sample t-test.
1.1. Possible problem formulations
This type of test is mostly used when examining differences in a test variable as can be observed in a group before and after a treatment or before and after a certain procedure. Furthermore, the t-test for paired samples is used for observation pairs, for example when comparing male and female spouses with each other. The t-test is thus suitable for questions such as “Is there a difference in the subjects’ responsiveness before and after taking medication?” or “Does the consumer behavior of spouses differ?”.
2. Procedure
2.1 Hypothesis formulation
The procedure for conducting a t-test for two paired samples is explained based on a question taken from market research.
A group of respondents is asked to rate the quality of a certain product on a scale of 0 to 10 (with 0 = “very bad” and 10 = “very good”) once before and once after they watched a commercial for that product. The research question can be formulated as follows:
Does showing the commercial influence the viewers’ opinion of the product’s quality?
The aim of this research is to find out whether showing the commercial influences the opinion concerning the product’s quality.
2.1 Hypothesis formulation
To test the research question statistically, it is necessary to formulate hypotheses. It should thus be possible to determine if the difference in the sample means can be generalized onto the population underlying the samples.
The null hypothesis and the alternative hypothesis are as follows:
H0: μ1=μ2 The means of both parent populations are the same.
HA: μ1≠μ2 The means of both parent populations differ.
2.2 Calculating the test statistic
To test the hypothesis, it is first necessary to obtain data. (see Table 1: Example data).
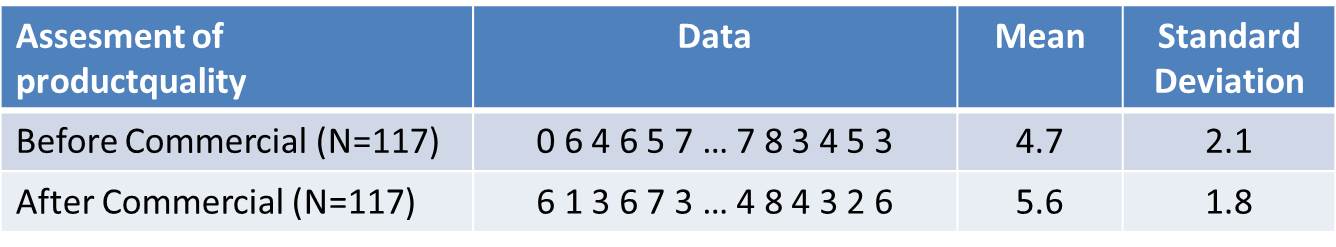
Table 1: Example data
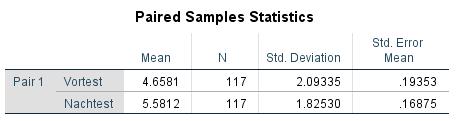
Based on the means in “Table 1: Example data,” it can be assumed that opinions on product quality will differ before and after running the commercial. With the help of the t-test it is now possible to determine if this difference is also statistically significant.
The name of the test is derived from the test statistic, which is t-distributed if the null hypothesis proves to be valid. The test statistic t can be shown as follows:
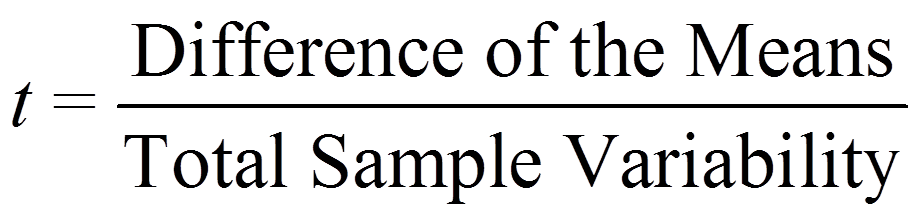
Numerators and denominators are calculated as follows:
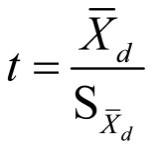
with
Sd = standard deviation of the difference in the sample pairs
Xd = mean of the difference in the sample pairs
Based on the difference in the sample pairs in the equation, it becomes clear that the samples are linked. Every test statistic from one sample can be allocated precisely to one test statistic from the other sample.
Note: It is also very important that the values of one observation pair are entered in the same row in SPSS so that it can allocate the test values correctly.
2.3 Conducting the hypothesis test
The hypothesis test is conducted by comparing the critical value of the test distribution as determined by degrees of freedom. In the case of a t-test with paired samples, the calculated t-value is compared with the critical value of the theoretical t-distribution.
3. T-test with SPSS